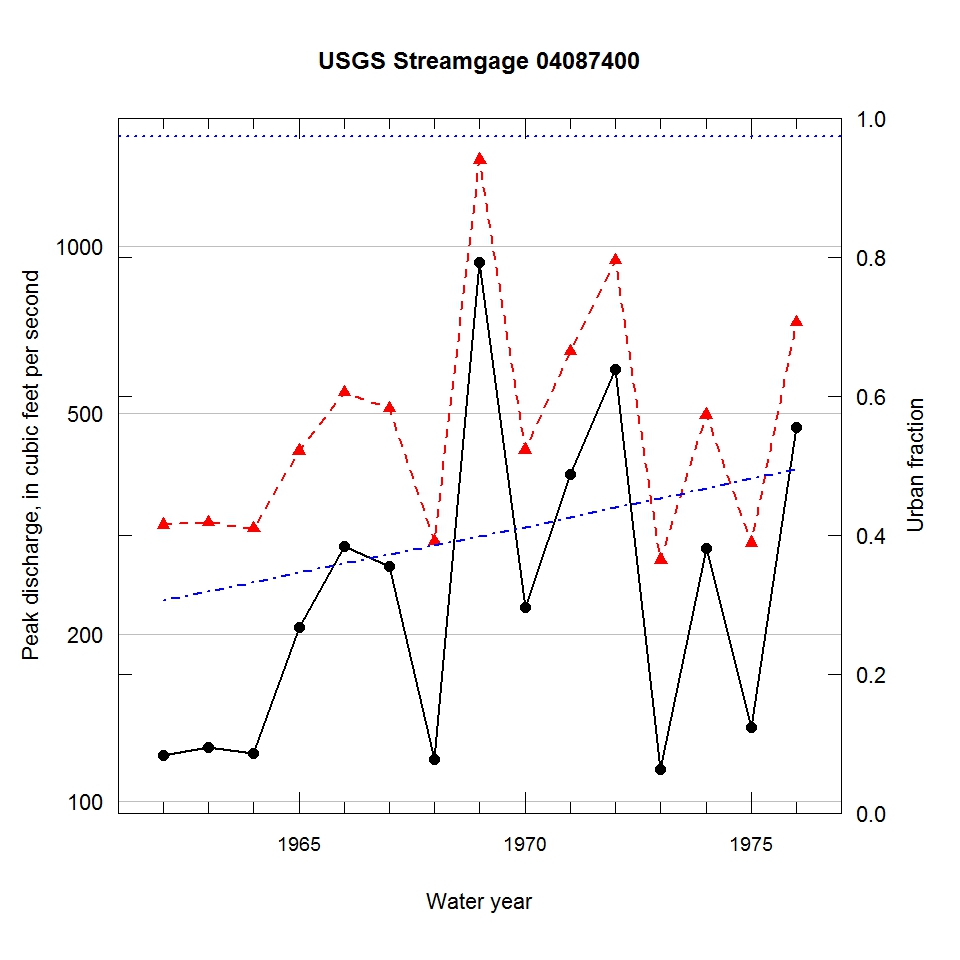
Observed and urbanization-adjusted annual maximum peak discharge and associated urban fraction and precipitation values at USGS streamgage:
04087400 KELLOGG RAVINE AT ZION, IL


| Water year | Segment | Discharge code | Cumulative reservoir storage (acre-feet) | Urban fraction | Precipitation (inches) | Observed peak discharge (ft3/s) | Adjusted peak discharge (ft3/s) | Exceedance probability |
| 1962 | 1 | -- | 0 | 0.306 | 0.628 | 121 | 315 | 0.850 |
| 1963 | 1 | -- | 0 | 0.319 | 0.360 | 125 | 318 | 0.845 |
| 1964 | 1 | -- | 0 | 0.332 | 1.830 | 122 | 310 | 0.861 |
| 1965 | 1 | -- | 0 | 0.346 | 0.555 | 206 | 428 | 0.599 |
| 1966 | 1 | -- | 0 | 0.359 | 0.468 | 288 | 545 | 0.345 |
| 1967 | 1 | -- | 0 | 0.372 | 1.291 | 265 | 510 | 0.420 |
| 1968 | 1 | -- | 0 | 0.385 | 0.991 | 119 | 294 | 0.892 |
| 1969 | 1 | -- | 0 | 0.398 | 1.083 | 937 | 1430 | 0.012 |
| 1970 | 1 | -- | 0 | 0.411 | 1.040 | 224 | 430 | 0.593 |
| 1971 | 1 | -- | 0 | 0.425 | 0.428 | 388 | 646 | 0.189 |
| 1972 | 1 | -- | 0 | 0.439 | 1.159 | 601 | 943 | 0.048 |
| 1973 | 1 | -- | 0 | 0.453 | 1.408 | 114 | 272 | 0.927 |
| 1974 | 1 | -- | 0 | 0.467 | 1.072 | 285 | 497 | 0.446 |
| 1975 | 1 | -- | 0 | 0.481 | 0.319 | 136 | 292 | 0.897 |
| 1976 | 1 | -- | 0 | 0.495 | 1.264 | 471 | 729 | 0.132 |

